|
FreeComputerBooks.com
Links to Free Computer, Mathematics, Technical Books all over the World
|
|
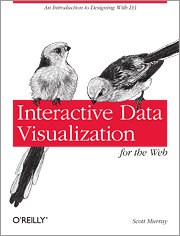
- Title: Interactive Data Visualization for the Web: An Introduction to Designing With D3
- Author(s) Scott Murray
- Publisher: O'Reilly Media (March 22, 2013)
- Paperback: 250 pages (est.)
- eBook: HTML and PDF
- Language: English
- ISBN-10/ASIN: 1449339735
- ISBN-13: 978-1449339739
- Share This:

|
Create and publish your own interactive data visualization projects on the Web, even if you have no experience with either web development or data visualization. It's easy with this hands-on guide. You'll start with an overview of data visualization concepts and simple web technologies, and then learn how to use D3.js, a JavaScript library that lets you express data as visual elements in a web page.
Interactive Data Visualization for the Web makes these skills available at an introductory level for designers and visual artists without programming experience, journalists interested in the emerging data journalism processes, and others keenly interested in visualization and publicly available data sources.
About the Authors- Scott Murray is a code artist who writes software to create data visualizations and other interactive phenomena. His work incorporates elements of interaction design, systems design, and generative art.
- Data Visualization
- JavaScript Frameworks (jQuery, Node.js, AngularJS, Backbone.js, ...)
- JavaScript Programming
- Web Programming
- Data Analysis and Data Mining

- O'Reilly® Interactive Data Visualization for the Web: An Introduction to Designing With D3
- The Mirror Site (1) - PDF
- The Mirror Site (2) - ePub
-
 Data Visualization in Python (Daniel Nelson)
This is a book for beginner to intermediate Python developers and will guide you through simple data manipulation with Pandas, cover core plotting libraries like Matplotlib and Seaborn, as well as experimental libraries like Altair.
-
 Modern Data Visualization with R (Robert Kabacoff)
This book describes the many ways that raw and summary data can be turned into visualizations that convey meaningful insights. It is written for those new to data analysis as well as the seasoned data scientist.
-
 Fundamentals of Data Visualization: Informative Figures
This book takes you through many commonly encountered visualization problems, and it provides guidelines on how to turn large datasets into clear and compelling figures, teaches you the elements most critical to successful data visualization.
-
 Data Visualization: A Practical Introduction (Kieran Healy)
It provides a hands-on introduction to the principles and practice of data visualization. It explains what makes some graphs succeed while others fail, how to make high-quality figures from data using powerful and reproducible methods.
-
 Hands-On Data Visualization: From Spreadsheets to Code
This book takes you step-by-step through tutorials, real-world examples, and online resources. This practical guide is ideal for anyone who wants to take data out of spreadsheets and turn it into lively interactive stories.
-
 Data + Design: Preparing and Visualizing Information
This book conveys a strategy for data analysis that stresses the use of visualization to thoroughly study the structure of data and to check the validity of statistical models fitted to data. It explains important data concepts in simple language.
-
 Data Analysis with Python (Numpy, Matplotlib and Pandas)
Understand data analysis pipelines using machine learning algorithms and techniques with this practical guide, using Python. Equipped with the skills to prepare data for analysis and create meaningful data visualizations for forecasting values from data.
-
 R Graphics Cookbook: Practical Recipes for Visualizing Data
This cookbook provides more than 150 recipes to help scientists, engineers, programmers, and data analysts generate high-quality graphs quickly - without having to comb through all the details of R's graphing systems.
-
 IPython Interactive Computing and Visualization Cookbook
This book contains many ready-to-use, focused recipes for high-performance scientific computing and data analysis, from the latest IPython/Jupyter features to the most advanced tricks, to help you write better and faster code.
-
 Data Visualization for All (Jack Dougherty, et al)
This book shows how to design interactive charts and maps for your website, begins with drag-and-drop tools and gradually work our way up to editing open-source code templates, includes step-by-step tutorials, video screencasts, and real-world examples.


